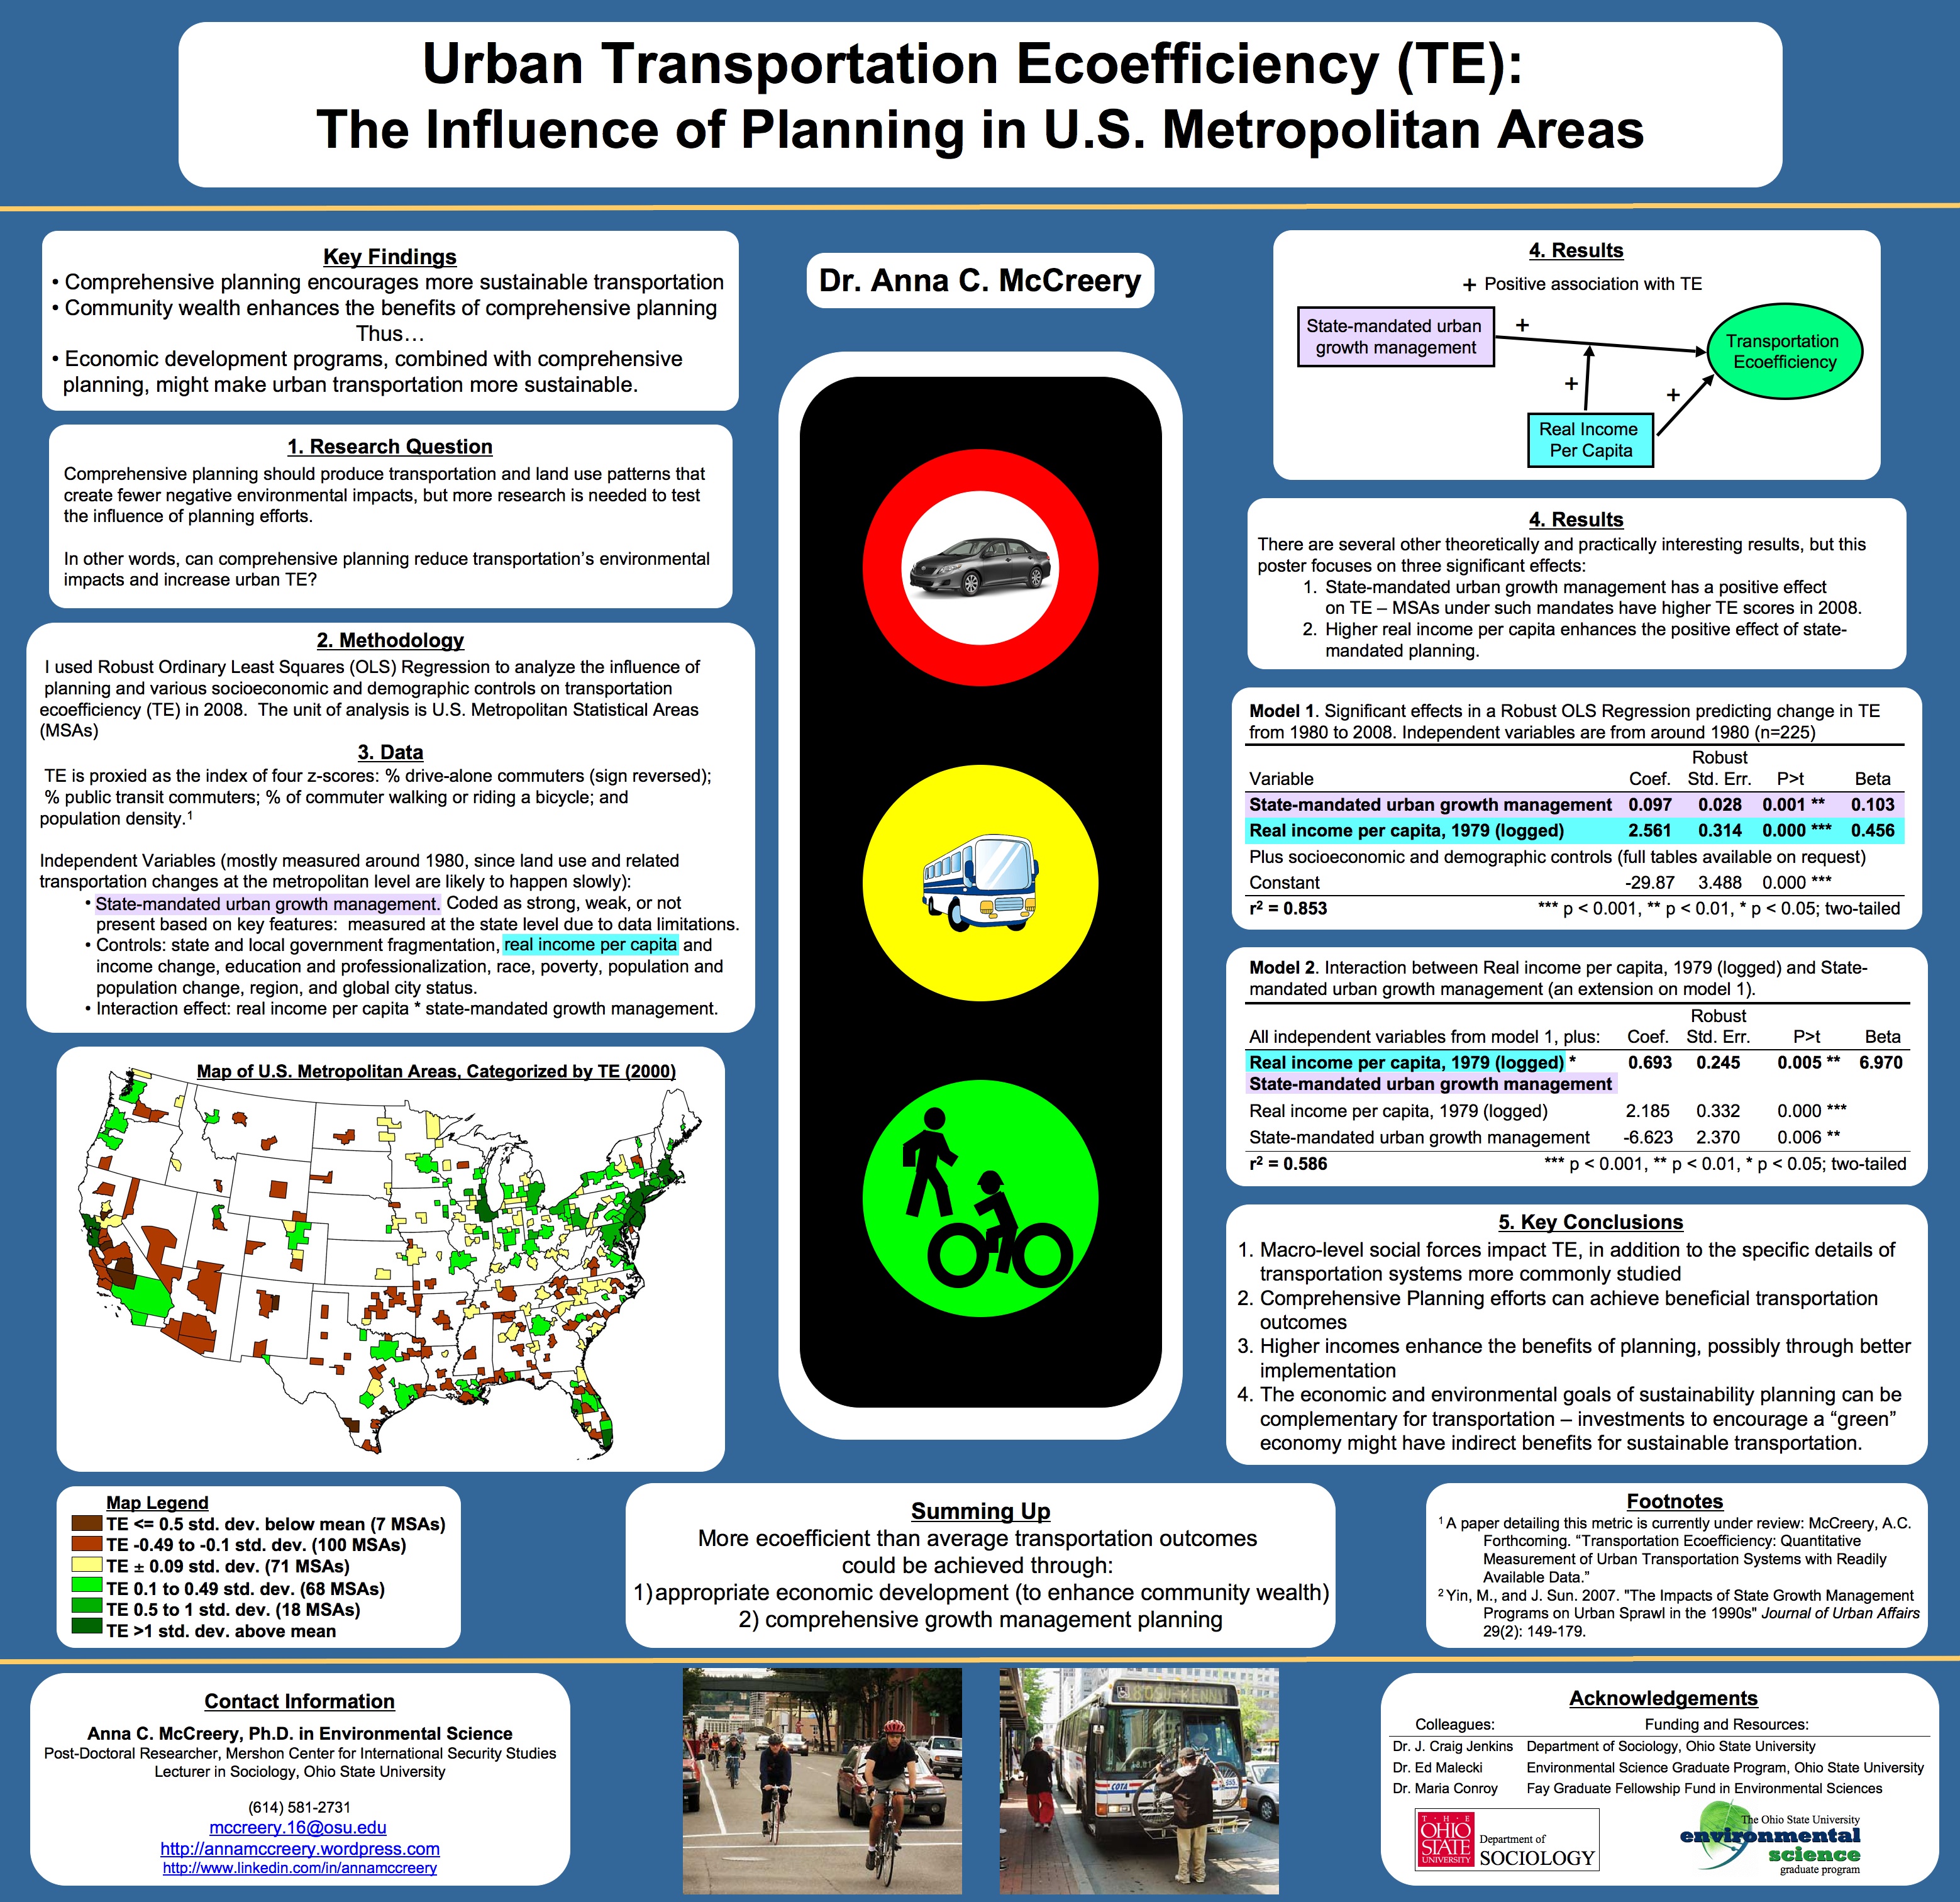
(pdf version)
As a resident of Columbus, I find it frustrating that I must rely on my car for basic transportation needs (although I don’t use it to commute). I often think that non-car transportation must be easier in other cities, so I ran an analysis to see whether this is the case.
Understanding Transportation Ecoefficiency (TE) Scores
The TE score measures environmental friendliness of the transportation system including everything: public transit, highways, walking and biking, and how spread out people are. It can be measured for different areas, such as metropolitan areas or whole countries, but here I’ll focus on counties. The TE score is derived from a statistic called a “z-score,” and it summarizes in a single number how much a county differs from the average of all counties in a study in terms of its Transportation Ecoefficiency or, basically, environmental friendliness. Four components go into calculating a TE score: 1) % of commuters who drive alone to work (higher means lower TE); 2) % of commuters who take public transit; 3) % of commuters who walk or ride a bicycle; and 4) population density, which affects average travel distances.
The TE score, then, provides a simple number that allows us to compare the counties in a state, region or the whole country using just a single number. This number is a quick measurement of the environmental friendliness of the local transportation system including everything – driving alone, public transit, walking and biking, and whether people are spread out (and need to travel further) or densely clustered.
With a higher TE score, more people us ecologically friendly transportation or travel fewer miles. The average for this score is zero (because of the statistical nature of z-scores), but the score will show whether a county is higher or lower than average for the environmental friendliness of transportation. Counties with TE scores above 0 have transportation patterns that are more environmentally friendly than the average, while scores below 0 indicate transportation patterns that are less environmentally friendly than average.
TE in Columbus, Ohio (Franklin County)
Franklin County, OH covers the most central, urban part of the city of Columbus, and county data for constructing TE scores is available from the 2010 American Community Survey. The American Community Survey has data for a sample of 376 of the more populous urban counties in the U.S. (counties with at least 65,000 population). The table below shows averages for each component for this national sample of counties, and the values for Franklin County:
| TE Score, and values for the 4 components |
Average |
Franklin County |
Range |
| Drive-alone commuters |
78% |
82% |
6.6% (New York County, NY) to 89.5% (Trumbull County, OH) |
| Public transit commuters |
3.9% |
2.6% |
0% (Pinal County, AZ) to 61.8% (Kings County, NY) |
| Walking/bicycling commuters |
3.4% |
2.9% |
0.5% (Houston County, AL) to 21.8% (New York County, NY) |
| Population Density * |
1,437 |
2,186 |
29 (5 different counties) to 69,468 (New York County, NY) |
| TE Score |
0 |
-0.16 |
-0.72 (Houston County, AL) to 9.2 (New York County, NY) |
| * People per square mile |
Franklin County’s TE score of -0.16 is a little below the average. We can also see this by looking at each component, but the TE score gives a sense of how Franklin County stacks up using just one number.
Franklin County is also the most built-up portion of the Columbus metropolitan area, which means we have a long way to go to make transportation here sustainable. Commuting in Franklin County is heavily dominated by the automobile, like many urban counties in the U.S.
TE in Ohio
In some ways it’s more useful to compare Franklin to other Ohio counties. This sample includes 17 Ohio counties: Butler, Clark, Cuyahoga, Franklin, Geauga, Hamilton, Lake, Licking, Lorain, Lucas, Mahoning, Montgomery, Stark, Summit, Trumbull, Wayne, and Wood.
For these 17 counties, the average TE score is -0.34 (noticeably below the average for the U.S.), and it ranges from -0.66 (Trumbull County) to 0.08 (Wayne County).
Here’s how Franklin compares to a few other Ohio counties (in order by TE score):
| County |
Related City |
% Drive-Alone Commuters |
% Public Transit |
% Walking or Bicycling |
Population Density * |
TE Score |
| Wayne |
Wooster |
79% |
0.39% |
6.2% |
206 |
0.08 |
| Cuyahoga |
Cleveland |
80% |
4.9% |
2.9% |
2,800 |
-0.02 |
| Hamilton |
Cincinnati |
79% |
3.9% |
2.6% |
1,977 |
-0.09 |
| Franklin |
Columbus |
82% |
2.6% |
3.4% |
1,437 |
-0.16 |
| Montgomery |
Dayton |
82% |
2.5% |
2.6% |
1,159 |
-0.27 |
| Lucas |
Toledo |
83% |
1.3% |
2.9% |
1,296 |
-0.29 |
| Summit |
Akron |
86% |
1.5% |
1.4% |
1,312 |
-0.52 |
| Trumbull |
Warren |
90% |
0.29% |
1.7% |
340 |
-0.66 |
| Ohio average |
|
84% |
1.3% |
2.7% |
938 |
-0.34 |
| * People per square mile |
|
|
|
|
Franklin County is below average for the U.S. (and long way away from true sustainability), but it’s not doing too badly compared to other Ohio counties. Investing in public transit use might be an effective way to increase the environmental friendliness of Columbus transportation, since we’re already above-average for walking, bicycling, and dense housing that reduces the distance people travel. Increasing public transit, the component that we’re not doing so well on, would help increase our TE score.
Indeed, some Columbus neighborhoods have many features that encourage environmentally friendly transportation, such as dense housing close to shops, pleasant walking environments, and frequent transit service. Victorian Village and the Short North, German Village, and Neighborhood Launch in downtown Columbus are neighborhoods with easy environmentally friendly transportation options, but increasing transit service to the suburbs would also give more people the freedom to leave their cars at home.
Acknowledgements
Hugh Clark, President, CJI Research Corporation
Fay Graduate Fellowship in Environmental Sciences

 Anna C. McCreery, Ph.D.